Editorial Illustration
Datadog’s Illustration team works in collaboration with the Writing team to develop and create editorial illustrations for all of our blog content. Our aim is to bring meaning to complex, technical subjects while engaging our readers with bright, futuristic visuals that express the Datadog brand ethos. The style is imaginative and exciting, and often embraces real-world metaphors in order to simplify topics into accessible visual narratives.
Longform Monitoring Guides
Monitoring Guides are three-part series that aim to educate and inform users on how to set up and monitor third-party services with the Datadog platform. These series often explore subjects such as general knowledge and overview, key metrics to watch for, and setting up and monitoring with the Datadog platform.

01

02

03

04

05

06

07

08

09

10

11

12

Log Management
Log Management allows you to analyze log data across your stack, and is one of Datadog’s core products. Over the past several years the Illustration team has worked to develop a recurring theme using our beloved beaver character shown in various situations and scenarios relating to the editorial content.

01

02

03

04

05

06

07

08

Synthetic Monitoring
Across the tech industry robots are commonly used to communicate the idea of synthetic users. Datadog often uses its own unique robot character to explore themes and scenarios that users experience when performing synthetic testing.


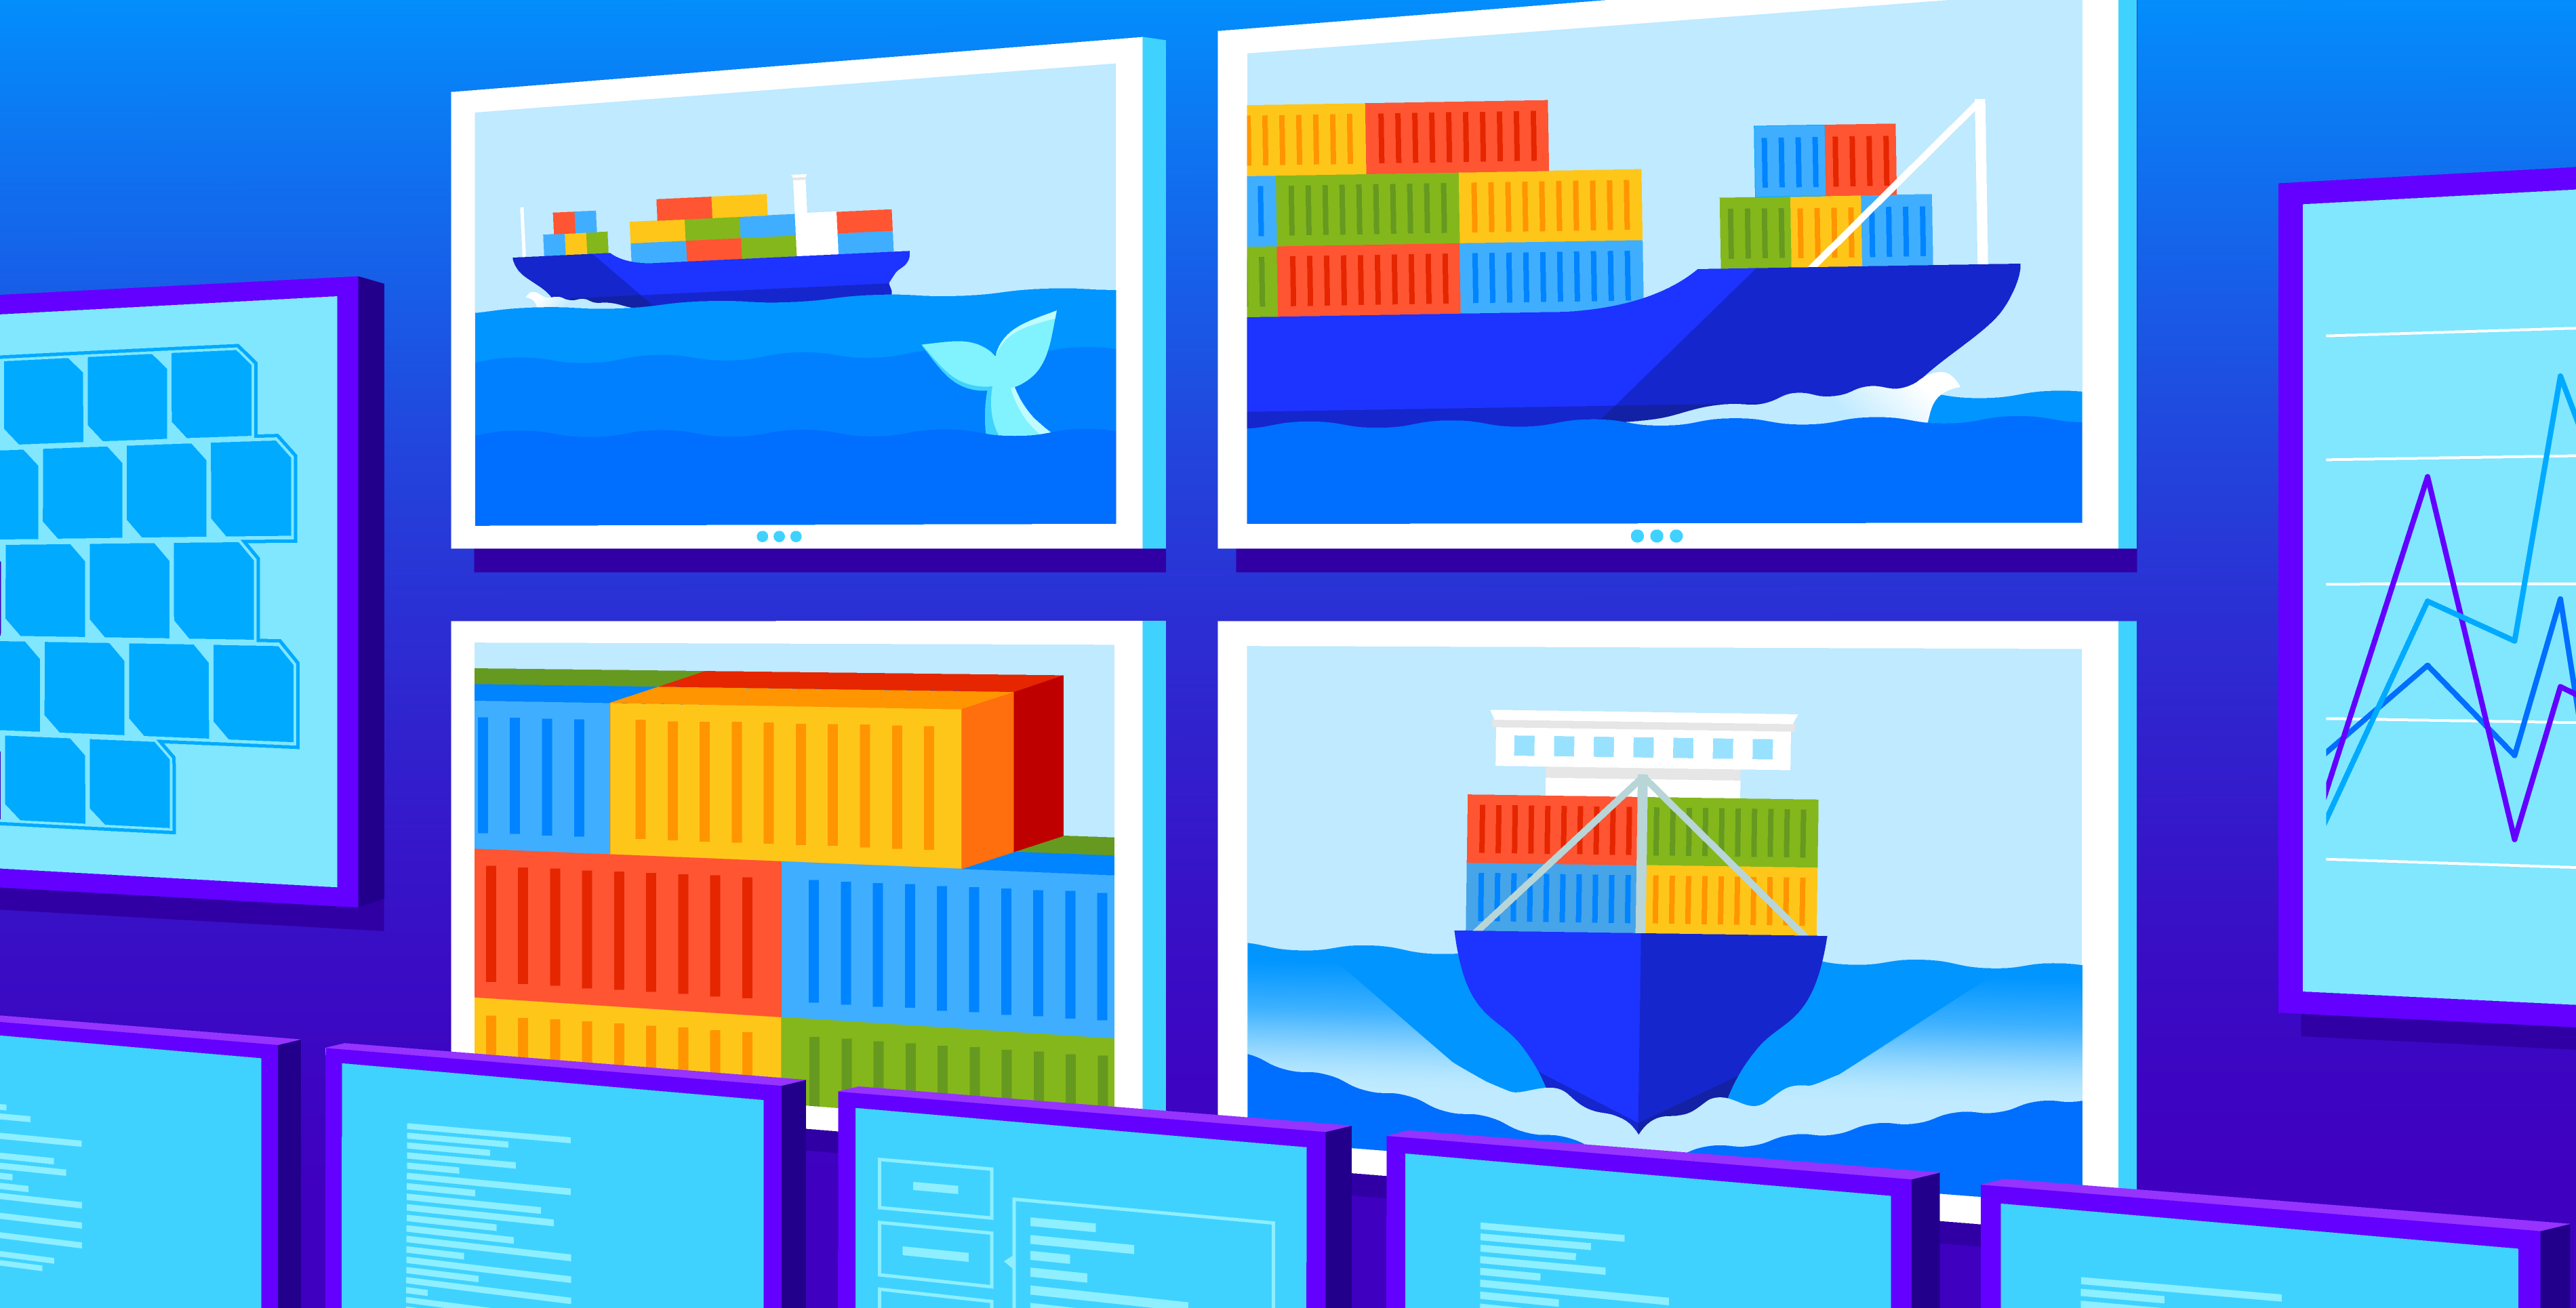
Container Management & Monitoring
Containerization is a key aspect in optimizing your stack’s performance. Whether it’s Kubernetes, Docker, or AWS, container management is a common subject on the Datadog blog. The universal symbol for containerization is a shipping container, and with that our illustrations explore various scenarios and metaphors where containers as a subject can be used to communicate the content of our writing.